Experiment Data
The Data Management module provides a user-friendly interface for submitting your experiment and associated files metadata to the GPAP, as well as browsing all experiments related to your group(s).
Data Submission
The image below displays the Data Submission dashboard, highlighting its key functionalities.
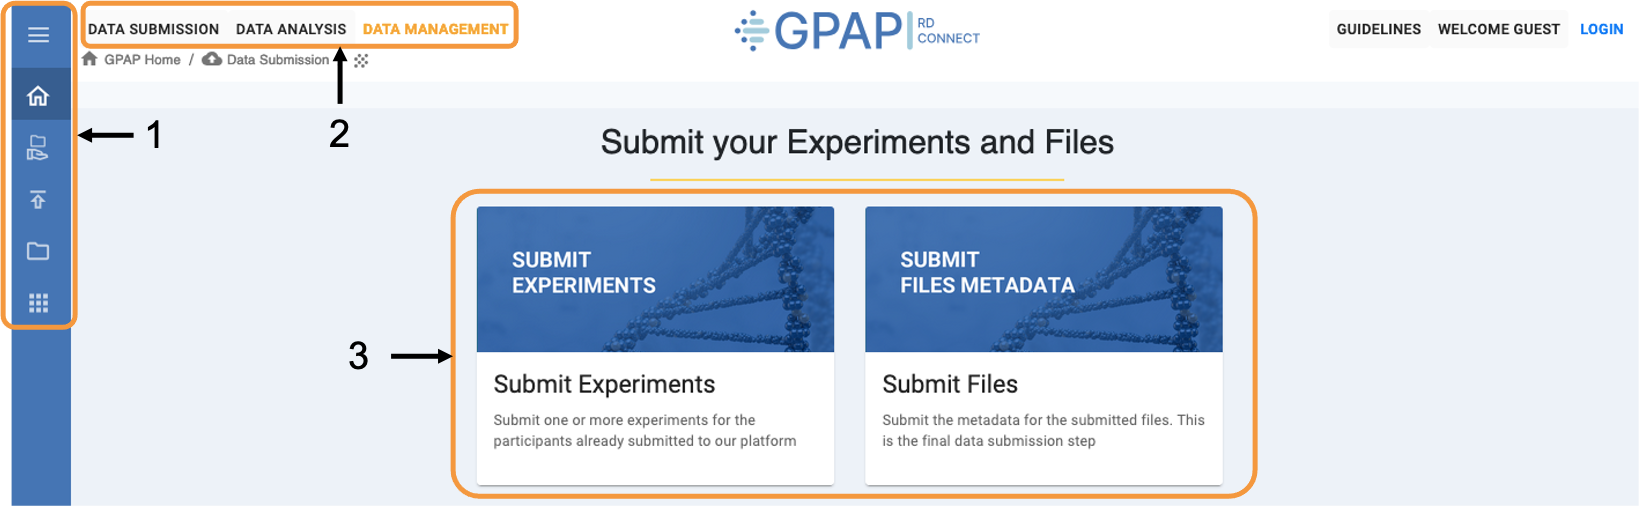
1 - Fixed sidebar across the Data Submission and Management module, providing quick access to various functionalities. Hover over the sidebar to expand and view descriptions of each icon.
2 - Toolbar for accessing other GPAP modules, including: Data Submission and Management (Experiment & Files, and Phenotypic Data) and Data Analysis (Genomic Analysis and Cohort Creation).
3 - Use this menu to submit your experiments and associated files metadata.
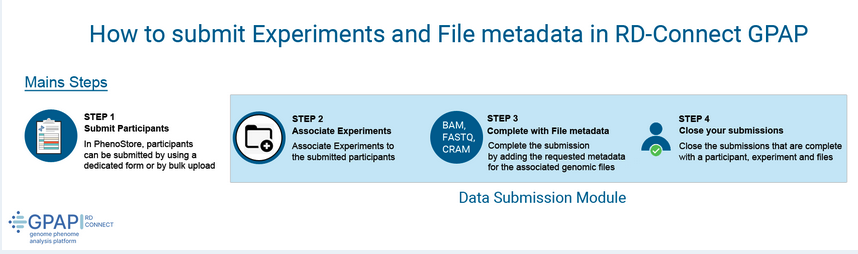
The process for submitting your experiments and files metadata to the GPAP is as follows:
Important
Please note that you will need the PhenoStore IDs to begin the data submission process (see the Phenotypic Data section of this manual).
Once this process is completed, you will receive an email with the credentials to upload your FASTQ/BAM/CRAM files via RedIris server or FTP (outside the GPAP website).
Submit Experiment Metadata
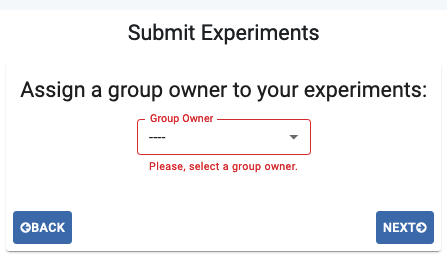
Click on the Submit Experiments section to start you experiment metadata submission.
The first step is to assign a group owner to your set of experiments. Select your desired option from your available groups in the Group Owner dropdown, and click Next to proceed.
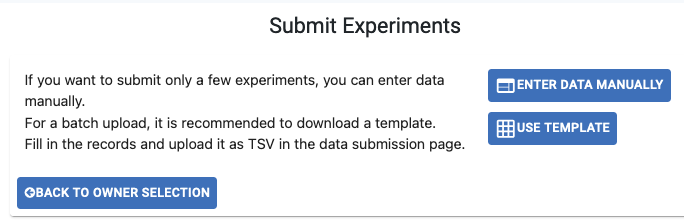
- There are two methods to submit the experiment metadata:
Enter Data Manually: Individual upload using the website’s form (one row per experiment).
Use Template: Bulk upload a .tsv file
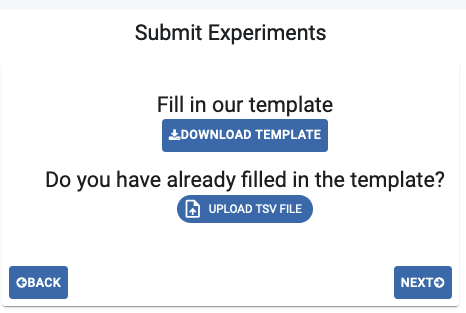
In the case of bulk upload, download the Template and fill it out, keeping in mind that mandatory fields are shown in red and dropdown menus with available options are provided for certain fields. If your option is not available, please contact our helpdesk at gpap@cnag.eu. Then, upload the file with the corresponding button (ensure the file is in tsv format). The Experiment Submission table will automatically be filled with the uploaded data.
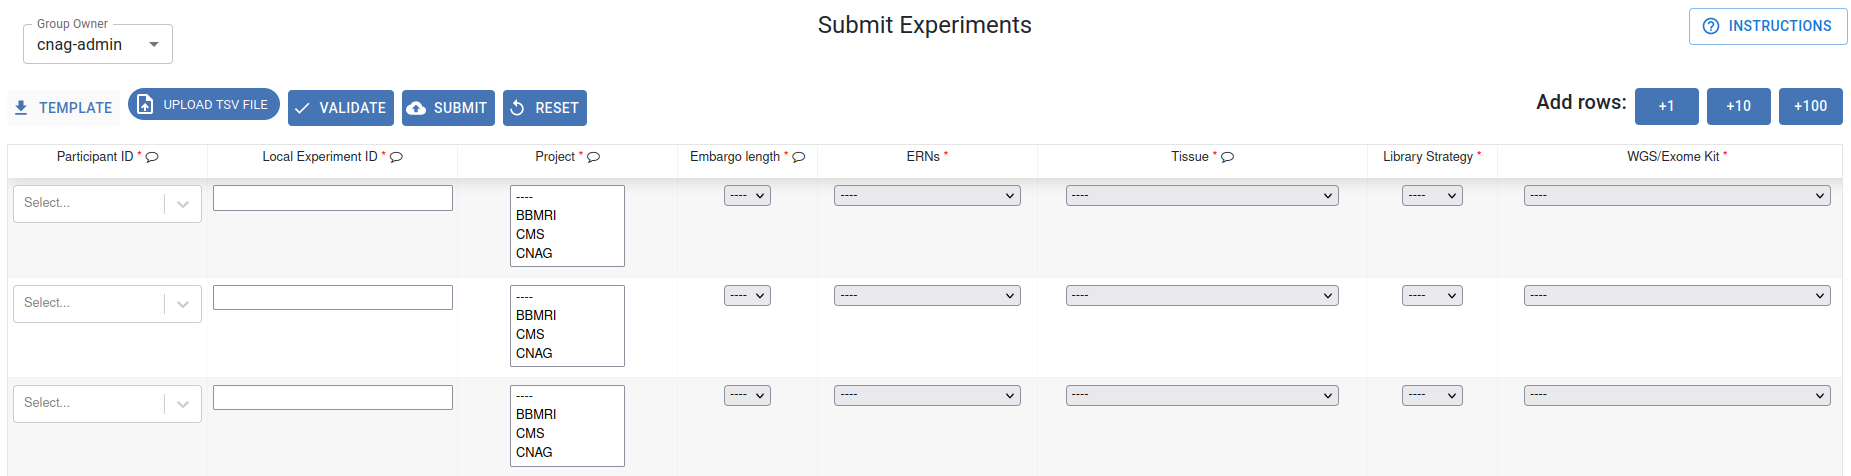
Experiment Submission table
For manual data entry, each experiment must be entered in a separate row of the table below. Mandatory fields are indicated with a red asterisk (*). Select your desired option from the dropdown menus. If your option is not available, please contact our helpdesk at gpap@cnag.eu.
If necessary, add more rows by clicking the +1, +10, or +100 buttons. You can consult the experiment submission procedure by clicking Instructions.
Once the table is completed, click Validate to check for any possible errors. If no errors are found, click Submit to continue with the submission.
Important
This step will generate new “GPAP Experiment IDs” for your experiments.
A new page will appear with a summary of your submitted experiments.
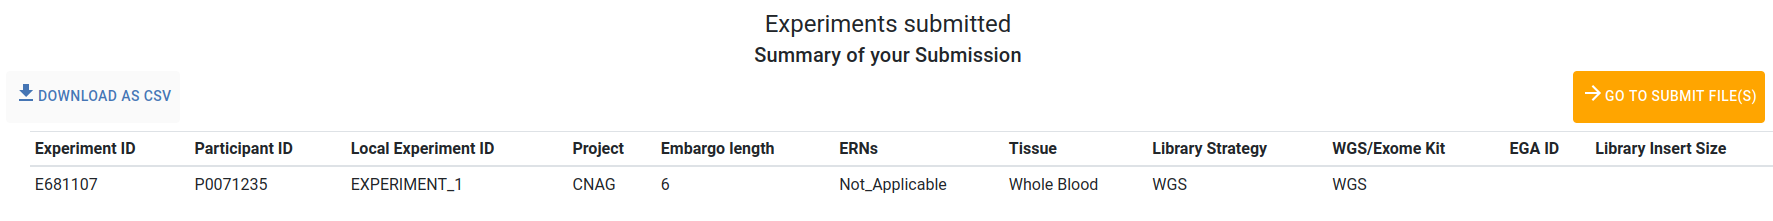
Use the Download as csv button to download a summary of your submitted experiment metadata, including the newly generated Experiment IDs. Use the Go to Submit File(s) button to proceed with submitting the files metadata.
Submit File Metadata
Access file metadata submission directly after experiment submission, or at any time from the dashboard, by clicking Submit File Metadata.
The accepted file formats are Illumina compressed (ideally using gzip) paired-end FASTQ, CRAM and BAMs.
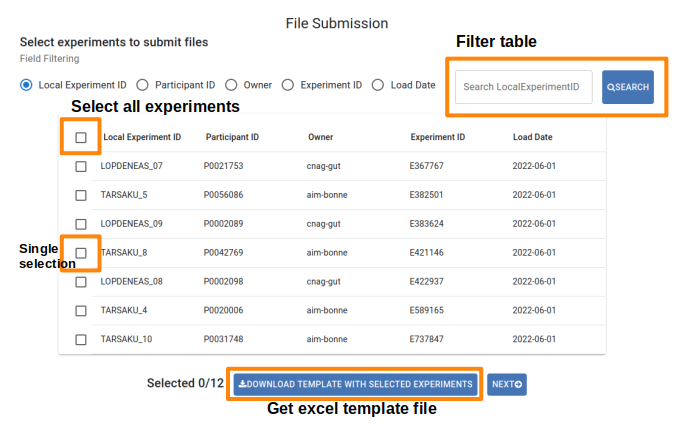
A list of your submitted experiments with pending file submissions will be displayed. The first step is to select the experiment(s) for which you will provide file metadata. You can select a particular field and use the search box at the top of the table to identify those experiments, or select all pending experiments by clicking the checkbox in the header. You can also delete any experiments for which you don’t have files to submit. Once ready, click Complete Submission to proceed.
File Submission table
- There are two methods to submit the file metadata:
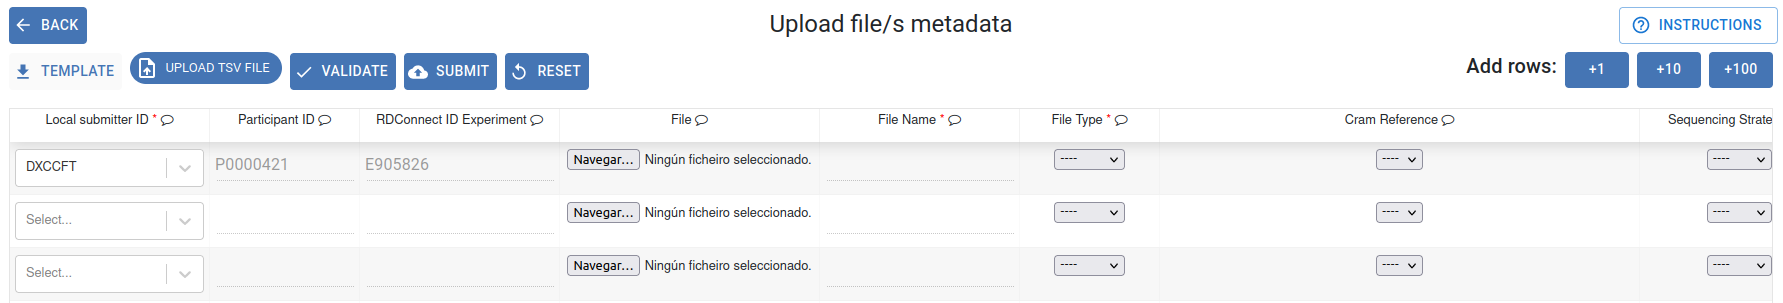
Enter Data Manually: Complete the File Submission table entering one file per row (the same experiment can have multiple rows). Mandatory fields are indicated with a red asterisk (*). Select your desired option from the dropdown menus. If your option is not available, please contact our helpdesk at gpap@cnag.eu. Click the Browse button to select your sequencing file from your system; its metadata will be recorded. However, the actual upload will occur in next step.
Use Template: Download the template and fill it out, mandatory fields are marked in red and dropdown menus with available options are provided for certain fields. If your option is not available, please contact our helpdesk at gpap@cnag.eu. Then, upload the file using the corresponding button (ensure the file is in tsv format). The File Submission table will automatically be filled with the uploaded data.
If necessary, add more rows by clicking the +1, +10, or +100 buttons. You can consult the file submission procedure by clicking Instructions.
Once the table is completed, click Validate to check for any possible errors. If no errors are found, click Submit to continue with the submission.
Important
Be aware this step is to upload file metadata, not to upload the sequencing files, which is done in Step-3 “Upload Sequencing Files”.
Important
You can upload multiple files for a given experiment if they are paired-end FASTQ (single-end FASTQ files are not accepted).
Our pipeline assumes just one experiment file submission in case of BAM or CRAM data. If more files are provided, the analysis will not proceed.
The analysis pipeline will not proceed if more than one file type is submitted for a particular experiment i.e. do not submit raw data in both BAM and FASTQ format. If you have both, submitting FASTQs is better.
A new page will appear with a summary of your submitted files.
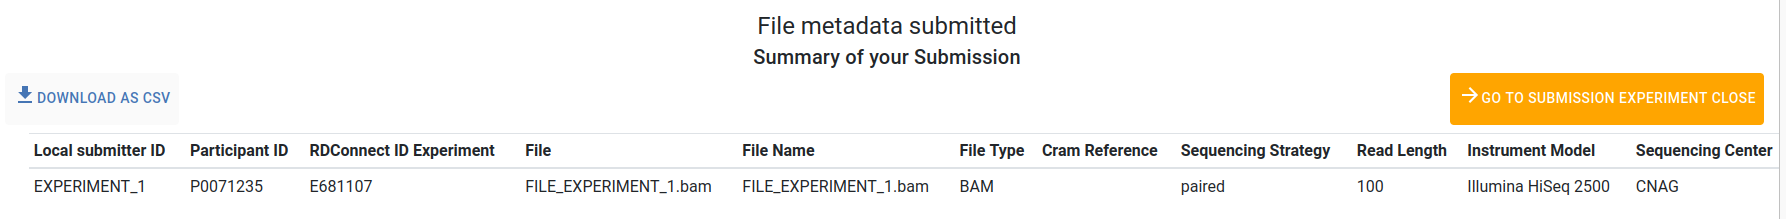
Use the Download as csv button to download a summary of your file metadata submitted.
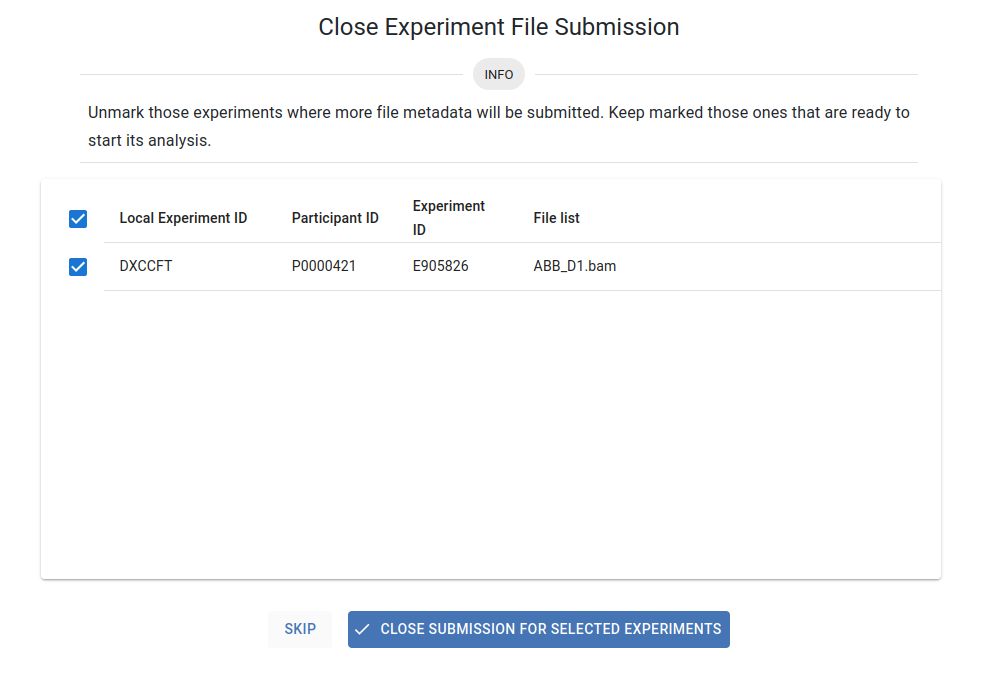
To finalise your submission, you must click Go To Submission Experiment Close. A list of your submissions pending closure will be displayed, with all them selected by default. Uncheck those experiments for which additional file metadata will be submitted, and keep checked those experiments for which all file metadata has been submitted. Press the Close Submission for Selected Experiments button to finalise the submission and trigger the pipeline analysis. Otherwise, click the Skip button.
Upload sequencing files through RedIris server
After closing your submission you will immediately receive an email titled “Submission of Sample file/s” with a summary of your submission.
- In the next 24 hours you will receive another email titled “Red Iris Account Created”. This email will contain:
Login credentials to use RedIris server (https://fileshare.rediris.es).
Instructions to upload sequencing files through Web.
Instructions to upload sequencing files through Command Line.
After you follow these instructions and the files are uploaded, we will download them from RedIris and begin the data processing.
Data Management
The image below displays the Data Management dashboard, highlighting its key functionalities.
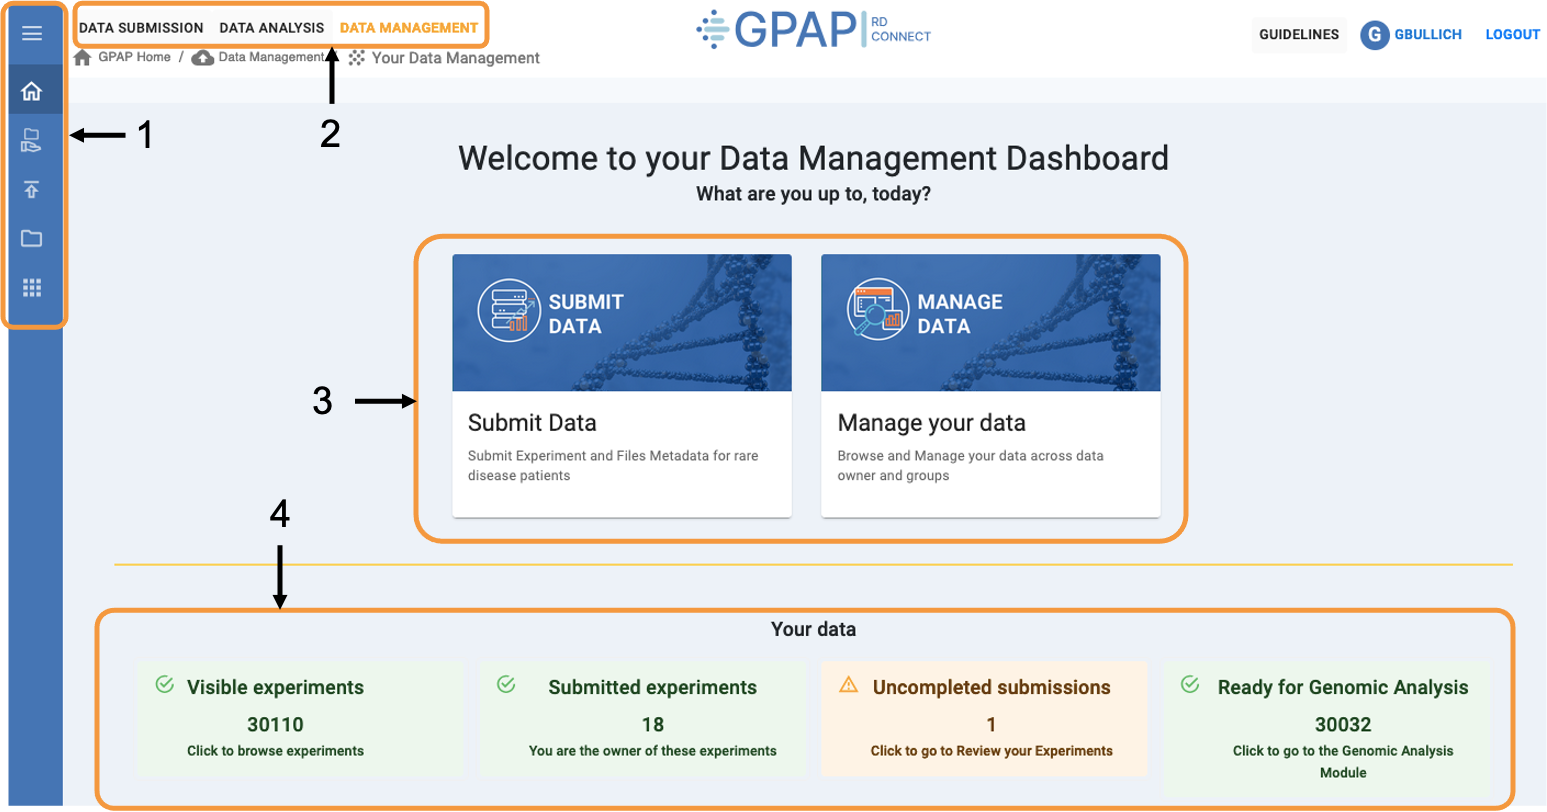
1 - Fixed sidebar across the Data Submission and Management module, providing quick access to various functionalities. Hover over the sidebar to expand and view descriptions of each icon.
2 - Toolbar for accessing other GPAP modules, including: Data Submission and Management (Experiment & Files, and Phenotypic Data) and Data Analysis (Genomic Analysis and Cohort Creation).
3 - Use this menu to submit data (it will redirect you to the Submit Data dashboard) and manage your data.
4 - Summary of your accessible GPAP experiments linked to the corresponding sections
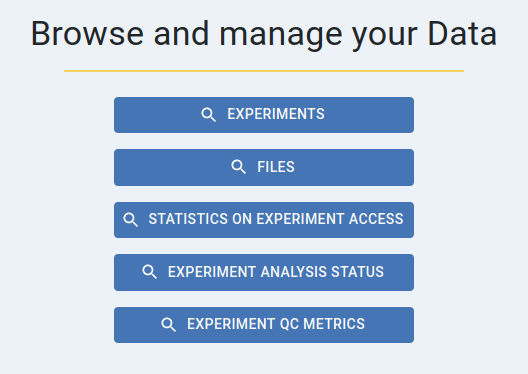
Click on the Manage Data section to explore the various options for browsing your data:
Experiments
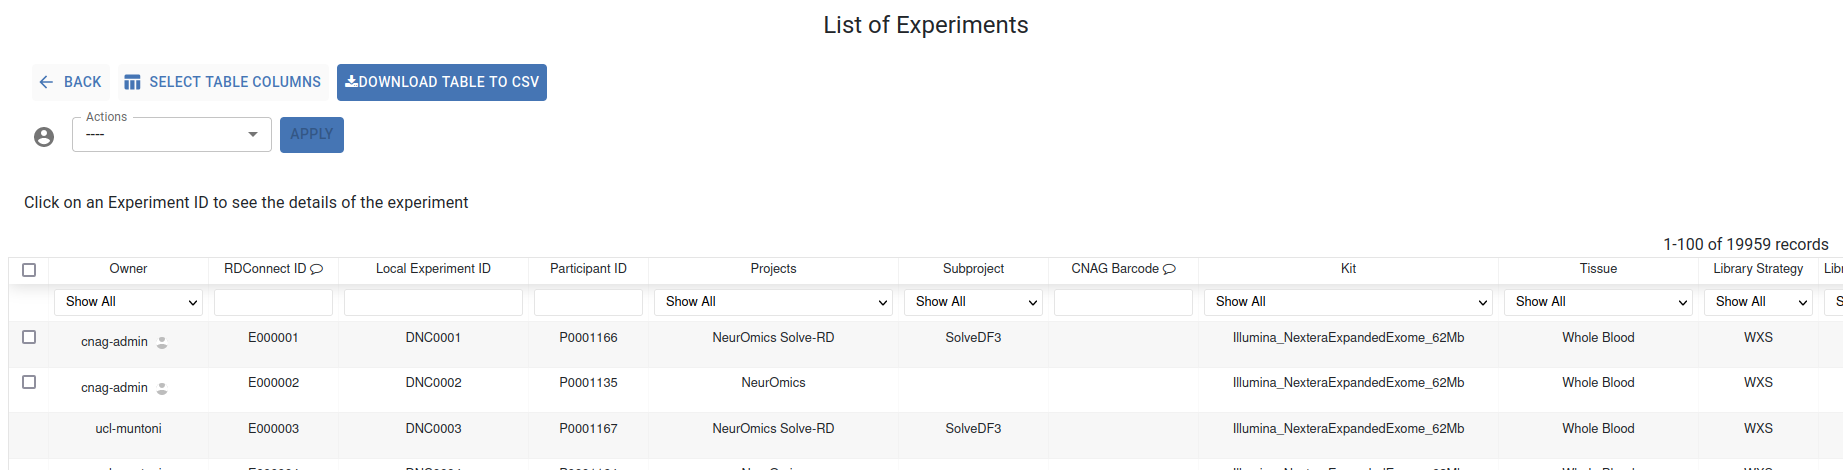
In this section, a list of all your accessible experiments metadata is diplayed in an interactive table where each column is filterable and sortable via its header.
The search bars located below the header allow you to find specific experiments. If you scroll to the right of this table, you can check the status of your experiments: Postembargo, Processed, In Platform, and Load Data.
Click on an Experiment ID or Participant ID to access the corresponding Experiment and Participant Summary. Clicking on the project name will show you statistics about the metadata of the experiments associated with that project.
The Select Table Columns button allows you to customize the displayed columns and you can download the data using the Download Table to CSV button.
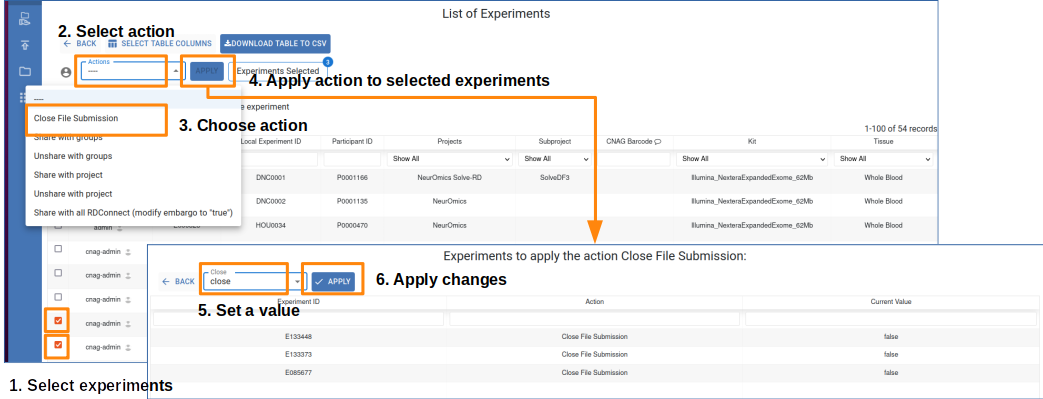
- The Actions dropdown lists the actions you can perform on samples you own:
Delete Experiment SUbmission Open
Close File Submission
Share with groups
Unshare with groups
Unshare with project
Share with all users (modify embargo to “true”)
- To apply changes to your experiments you should:
Select the experiments you own by clicking the row checkbox.
Select one of the available actions.
Click the apply button.
Select new values to apply to your experiments.
Apply changes
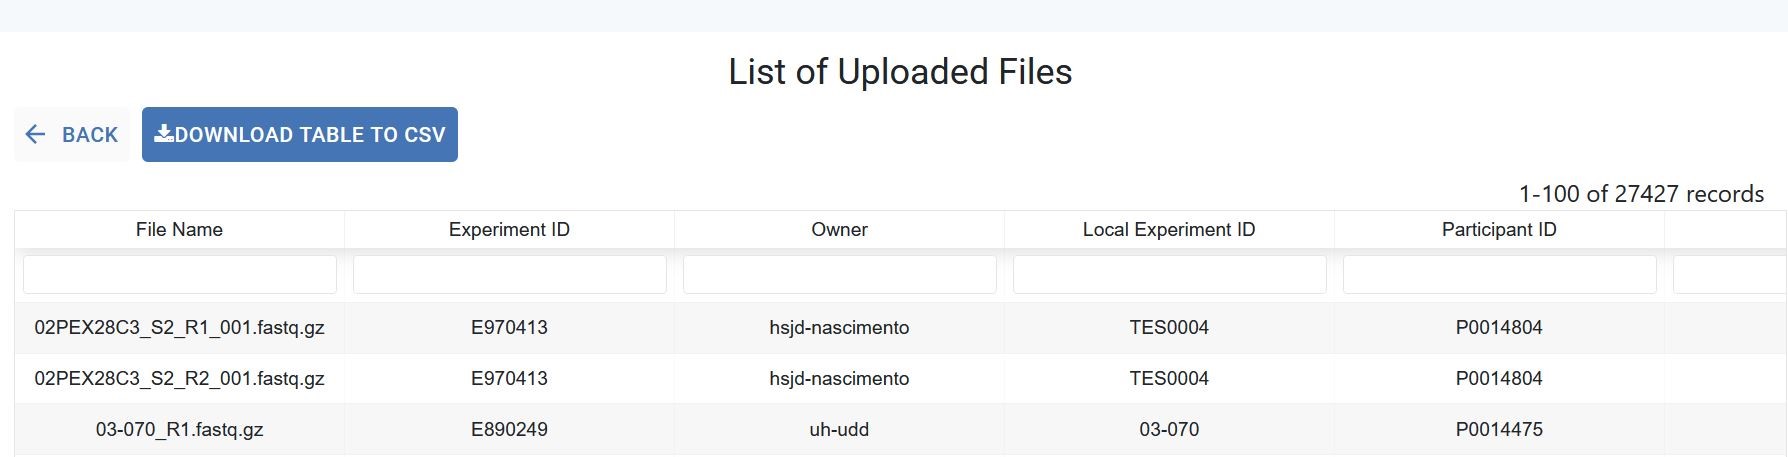
Files
In this section, a list of all the files associated to your experiments is diplayed in an interactive table where each column is filterable and sortable via its header. The search bars located below the header allow you to find specific files.
The Select Table Columns button allows you to customize the displayed columns and you can download the data using the Download Table to CSV button.
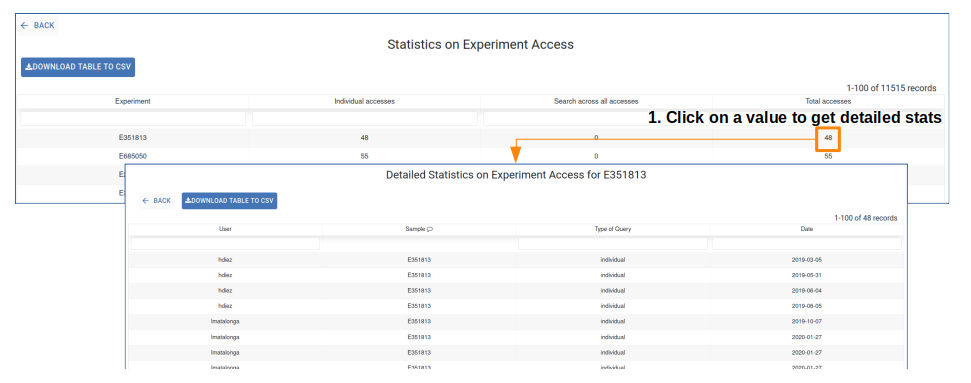
Statistics on Experiment Access
The table below displays the number of individual accesses, Search across all accesses, and total accesses for each of your accessible experiments. This table can be downloaded using the Download Table to CSV button.
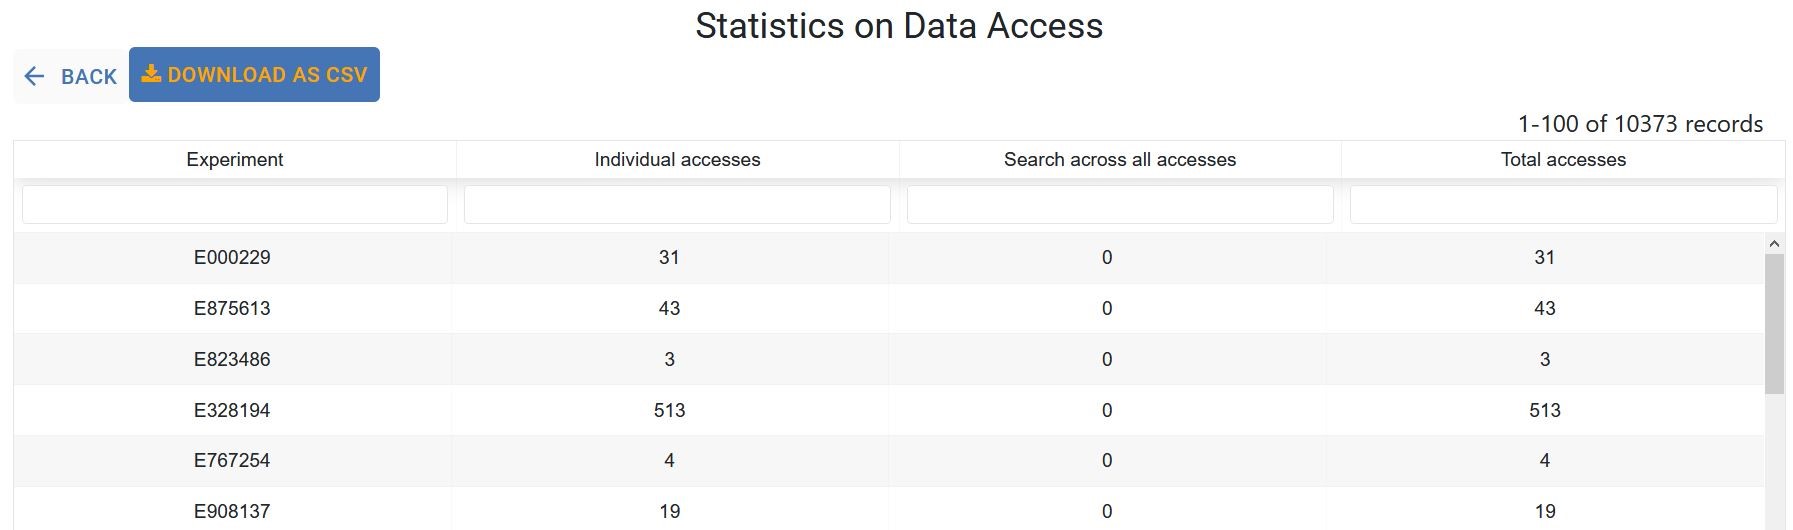
Click the Experiment code or any number in the list to view the user, query type and access dates for that experiment.
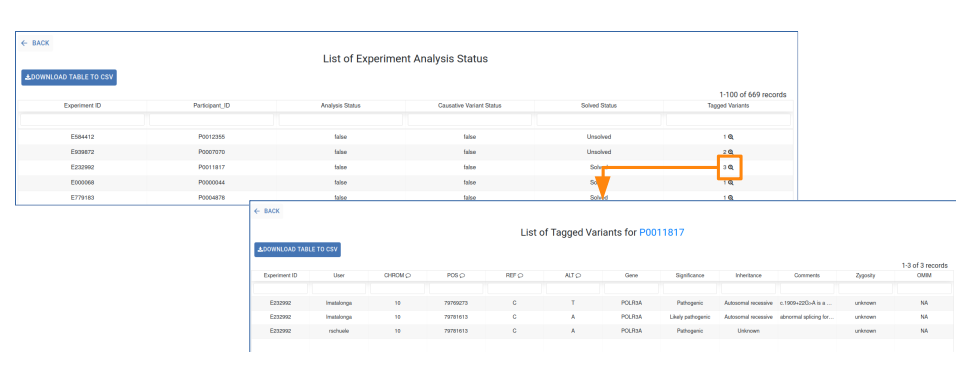
Experiment Analysis Status
This section displays the current status of your experiments by gathering information from genomic analysis (the Analysis Status, Causative Variant Status, and Tagged Variants columns) and PhenoStore (the Solved Status column). Refer to the corresponding Genomic and Phenotypic guidelines sections for instructions on modifying these status indicators. information about how to modify these status indicators. This table can be downloaded using the Download Table to CSV button.
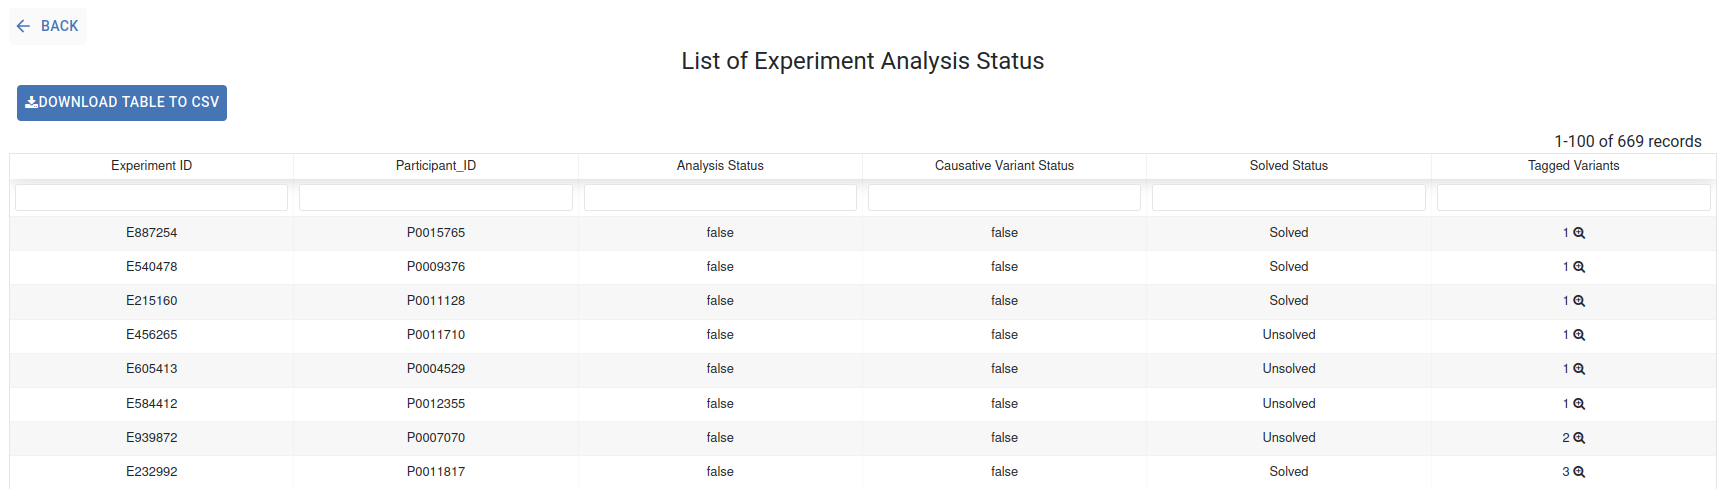
For more details about the Tagged Variants, click on the corresponding number
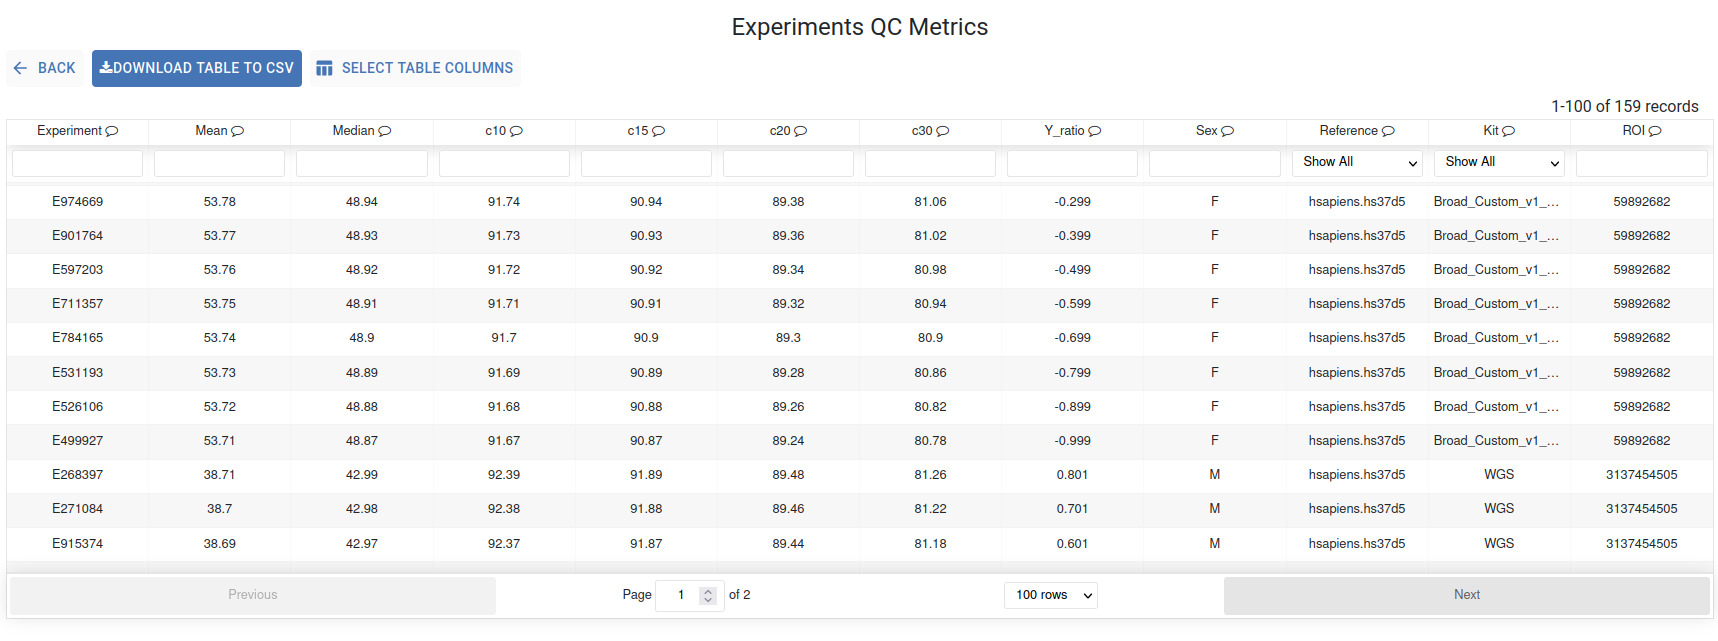
Experiment QC Metrics
The QC metrics of your experiments are presented in this interactive table, where each column is filterable and sortable via its header. Hover over the header to view the description of the displayed metric. The search bars located below the header allow you to find specific files.
The Select Table Columns button allows you to customize the displayed columns and you can download the data using the Download Table to CSV button.